How to Use Chrome DevTools to Inspect and Troubleshoot a Website
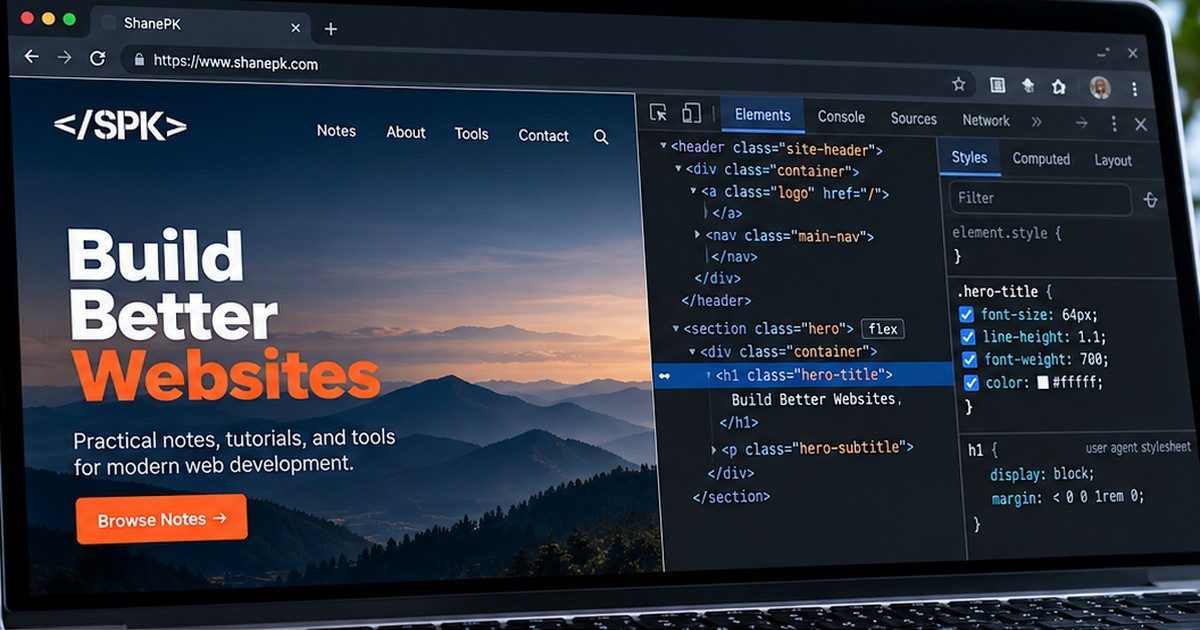
When a website looks wrong, loads slowly, throws an error, or simply refuses to do what you expect, you usually do not need to start by digging through the source code.
Your browser already contains one of the best website troubleshooting tools available: Chrome DevTools.
DevTools lets you inspect the HTML the browser actually received, see which CSS rules are being applied, watch files and API requests load, find JavaScript errors, test different screen sizes, and temporarily modify a page without changing the real website.
This tutorial covers the parts of Chrome DevTools I reach for most often when diagnosing everyday website problems.
Opening Chrome DevTools
The fastest way to inspect something on a page is to right-click it and choose Inspect.
That opens DevTools and usually takes you directly to the corresponding element in the Elements panel.
You can also open DevTools with a keyboard shortcut:
- macOS: Command + Option + I
- Windows or Linux: Ctrl + Shift + I
If you specifically want the element inspector, Chrome also provides:
- macOS: Command + Option + C
- Windows or Linux: Ctrl + Shift + C
Chrome maintains a complete Chrome DevTools reference if you want to go considerably deeper than we will here.
1. Inspect the HTML the Browser Is Actually Using
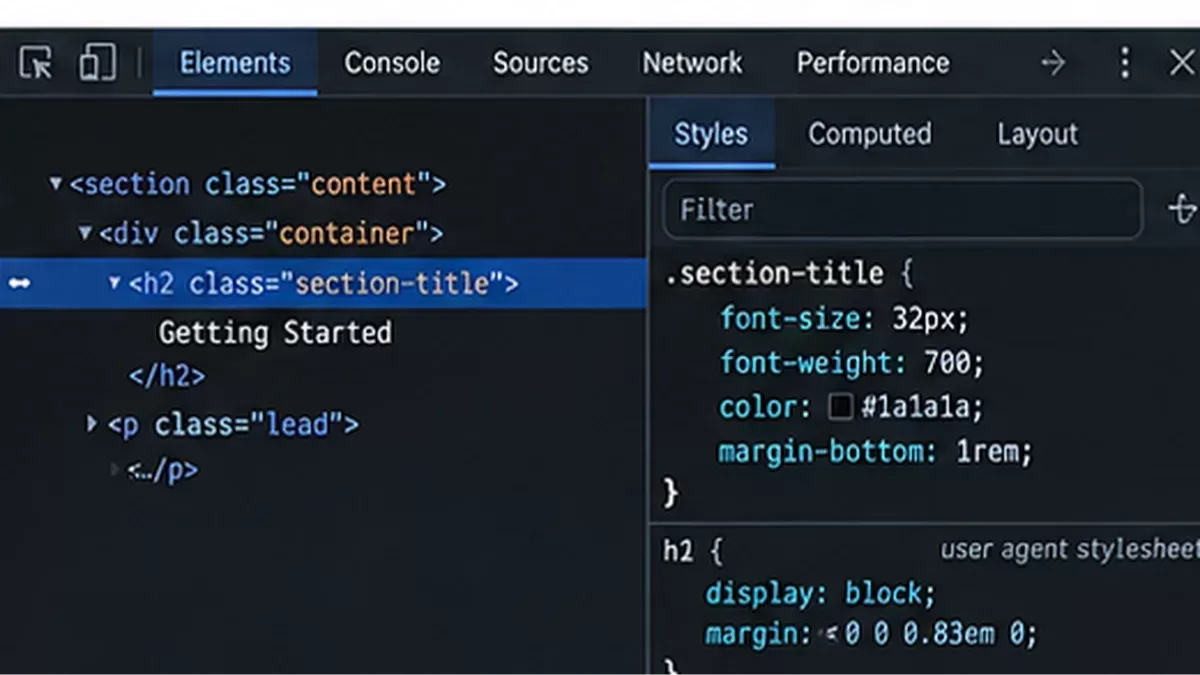
Start with the Elements panel.
This panel shows the page's current DOM: the document structure the browser is actually rendering. That distinction matters because the DOM may no longer exactly match the original HTML returned by the server. JavaScript can add, remove, move, or modify elements after the page loads.
Click the element selector in the upper-left corner of DevTools, then move your pointer over the page. Chrome highlights elements as you move across them.
Select one and DevTools jumps directly to that element in the DOM.
This is useful for answering basic questions quickly:
- Is the element actually present?
- Does it have the class or ID I expected?
- Did JavaScript change its markup?
- Is another element sitting on top of it?
- Is the browser rendering a different structure than I assumed?
You can double-click text, attributes, class names, and other values in the Elements panel to temporarily edit them.
That makes DevTools useful for more than debugging. It is also a fast way to prototype small front-end changes before editing your actual files.
2. Find Out Why Your CSS Is Not Working
Selecting an element also displays its CSS in the Styles panel.
This is where many front-end problems become obvious.
DevTools shows which selectors match the selected element and which declarations are actually taking effect. If a declaration has been crossed out, another CSS rule has overridden it.
You can toggle individual declarations on and off or type entirely new CSS properties directly into the panel.
For example, if a card has an unexpected width, try changing:
width: 100%;to:
width: 50%;You will see the result immediately without saving a file or rebuilding the application.
Do not forget the Computed panel
When several stylesheets, inherited values, component styles, and media queries are involved, the Styles panel can become noisy.
Switch to Computed when you simply want to know the final value the browser chose.
If you expected an element to have a 24-pixel margin but the browser says it has 16 pixels, the Computed panel gives you a much better starting point than guessing.
3. Check the Console Before You Assume the Website Is Broken
The Console is one of the first places I look when JavaScript-driven functionality stops working.
A broken menu, form, modal, analytics event, product selector, or integration may leave an error here that points directly at the problem.
Common console messages include:
- JavaScript exceptions
- Undefined variables or functions
- Failed resource loads
- Content Security Policy violations
- Deprecated browser features
- Messages intentionally logged by the application
Do not assume every yellow or red message is the cause of your problem. Modern sites frequently load third-party scripts, browser extensions, analytics tools, advertising code, widgets, and other software that can generate unrelated console noise.
Instead, reproduce the problem and watch what appears at that moment.
A useful Console shortcut
When you select an element in the Elements panel, Chrome makes that element available
in the Console as $0.
You can experiment with it directly:
$0.classListor:
getComputedStyle($0).displayThat gives you a quick bridge between visual inspection and JavaScript debugging.
4. Use the Network Panel When Something Fails to Load
If the browser needs a file or some piece of data, the Network panel lets you watch that request happen.
This includes HTML documents, CSS, JavaScript, images, fonts, API calls, analytics requests, and many other resources.
Open the Network panel and reload the page. You will see requests appear as the browser processes them.
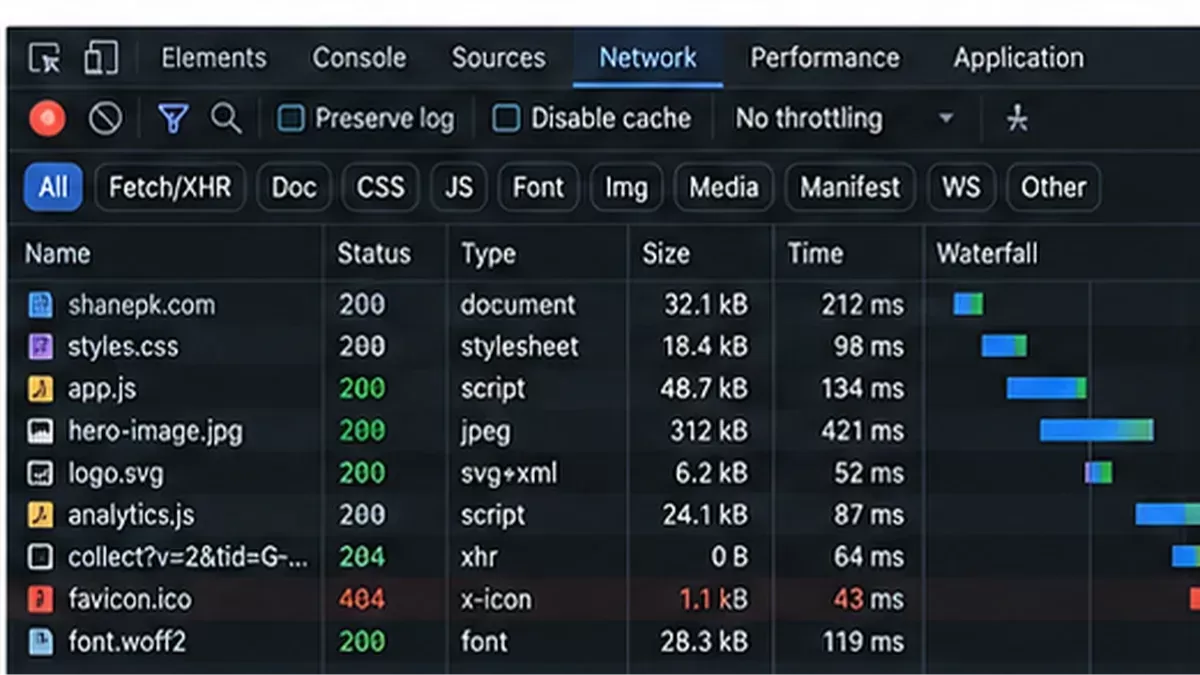
Several columns are particularly useful:
- Name: the requested resource
- Status: the HTTP response status
- Type: document, image, script, fetch, XHR, and so on
- Size: how much data was transferred
- Time: how long the request took
HTTP status codes tell you a lot
A 200 generally means the request succeeded. A 404 means the
requested resource could not be found. A 403 indicates that access was
forbidden. A 500-series response generally points toward a server-side
failure.
If an image is missing from a page, for example, filtering the Network panel to images can quickly tell you whether the browser requested the wrong path, the server returned an error, or the request never happened at all.
Inspect API requests
Modern websites frequently communicate with APIs using fetch() or XHR.
Filter the Network panel to Fetch/XHR to isolate those requests.
Click a request and you can inspect its URL, request method, headers, payload, response, timing information, and other details.
When a form says "Something went wrong," the Network panel often tells you considerably more than the user-facing error message does.
5. Test Responsive Layouts Without Owning Every Device
DevTools includes a device toolbar that lets you simulate different viewport sizes.
Toggle it from DevTools or use:
- macOS: Command + Shift + M
- Windows or Linux: Ctrl + Shift + M
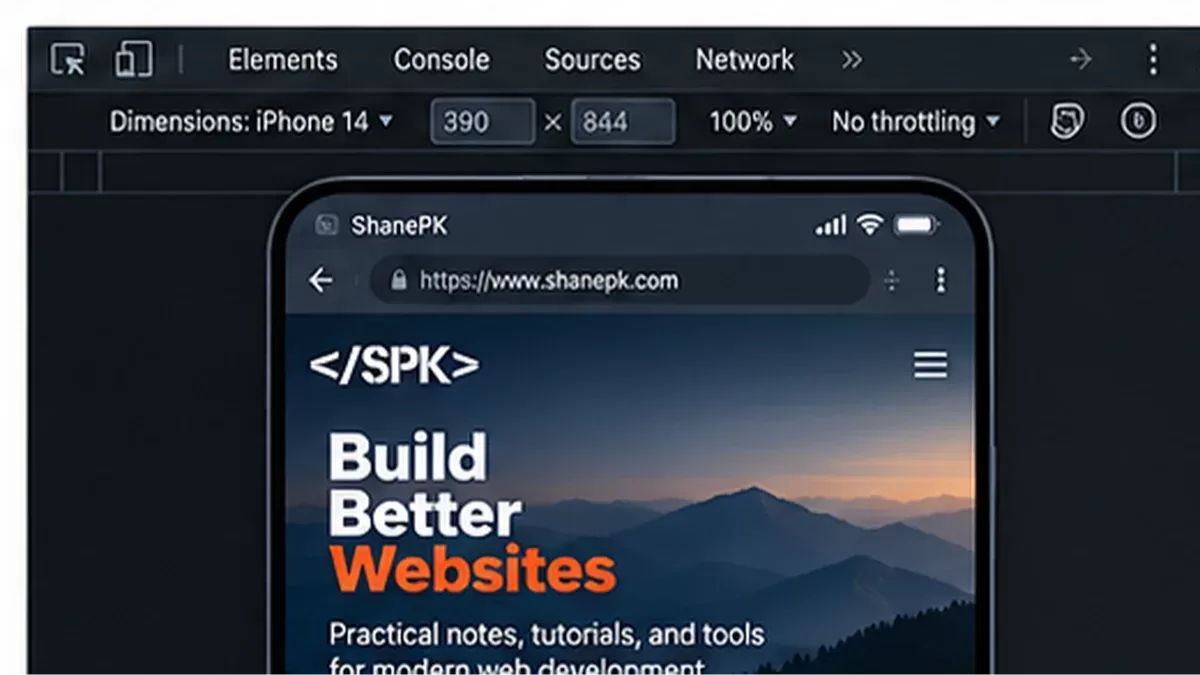
Preset devices are convenient, but I recommend dragging the viewport through a range of widths instead of checking only a few named phones.
Responsive bugs frequently happen between the standard breakpoints.
Watch for navigation wrapping unexpectedly, text colliding with controls, images overflowing containers, awkward spacing, horizontal scrolling, and layouts that become unusable shortly before or after a media query takes effect.
6. Use Lighthouse and PageSpeed Insights for a Broader Audit
DevTools is excellent for investigating individual problems, but sometimes you want a broader view of a page.
Chrome's Lighthouse tooling can audit areas including performance, accessibility, best practices, and search-engine optimization.
Google also provides PageSpeed Insights, which is useful when you want to evaluate a public URL without opening DevTools.
Treat the results as diagnostic information rather than a video-game score.
A recommendation only matters if it represents a meaningful problem for the website and its users. Chasing a perfect score while introducing unnecessary complexity can easily become counterproductive.
7. Validate the Markup When the DOM Looks Suspicious
Browsers are remarkably forgiving of malformed HTML. That is useful for users, but it can make development problems harder to spot.
When nested elements behave strangely or the DOM structure does not look the way you expected, validating the document can expose markup errors quickly.
The W3C HTML Checker is a useful companion to browser DevTools for this purpose.
It can identify problems such as invalid nesting, duplicate attributes, malformed elements, and other structural issues that a browser may silently attempt to repair.
A Simple Troubleshooting Workflow
When I am handed a website problem without much context, I usually work from the browser outward rather than immediately opening the codebase.
- Reproduce the problem. Make sure you understand exactly what is failing.
- Inspect the affected element. Verify that the DOM and CSS look the way you expect.
- Check the Console. Look for errors that appear while reproducing the issue.
- Check the Network panel. Verify that required files and API requests succeed.
- Test another viewport if layout is involved. Determine whether the problem depends on screen width.
- Only then move deeper into the application. At this point you usually have considerably more evidence about where to look.
That workflow prevents a surprising amount of wasted time.
Instead of starting with a theory about what the code might be doing, you begin with evidence about what the browser is actually doing.
The Browser Should Be One of Your Primary Development Tools
Frameworks, editors, build systems, AI assistants, monitoring platforms, and debugging services all have their place. But the browser is ultimately where a website has to work.
Learning to use DevTools well gives you direct visibility into that environment.
You can see the document the browser rendered, the styles it resolved, the JavaScript errors it encountered, the resources it requested, and the responses it received.
That makes DevTools useful whether you are learning HTML and CSS, maintaining a WordPress site, debugging an eCommerce application, investigating an integration, or working on a large front-end codebase.
You do not need to learn every DevTools panel at once. Start with Elements, Console, and Network. Those three alone can answer a remarkable number of everyday web development questions.
If you are interested in the broader development philosophy behind that approach, I wrote more about it in What 20 Years of Web Development Taught Me About Building Websites That Last .